Candlestick Charts
The Japanese have been using candlestick charts since the 17th century to analyze rice prices. Candlesticks were introduced into modern technical analysis by Steve Nison in his book Japanese Candlestick Charting Techniques.
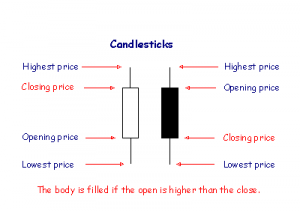
Candlesticks contain the same data as a normal bar chart but highlight the relationship between opening and closing prices. The narrow stick represents the range of prices traded during the period (high to low) while the broad mid-section represents the opening and closing prices for the period.
- If the close is higher than the open – the candlestick mid-section is hollow or shaded blue/green.
- If the open is higher than the close – the candlestick mid-section is filled in or shaded red.
The advantage of candlestick charts is the ability to highlight trend weakness and reversal signals that may not be apparent on a normal bar chart.
Shadow and Tail
The shadow is the portion of the trading range outside of the body. We often refer to a candlestick as having a tall shadow or a long tail.
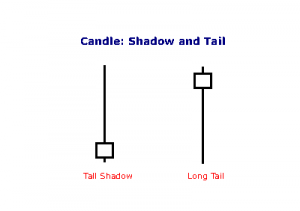
- A tall shadow indicates resistance;
- A long tail signals support.
Candlestick Colors
For improved presentation, Incredible Charts uses colors such as red and blue/green to indicate filled or hollow candlesticks:
- Blue (or green) candlestick if the close is higher than the open;
- Red candlestick if the open is higher than the close (i.e. the candlestick is filled);
- The same color as the previous day, if the open is equal to the close.
Candlestick Patterns
Long Lines
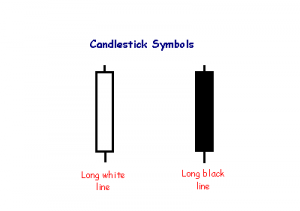
The long white line is a sign that buyers are firmly in control – a bullish candlestick.
A long black line shows that sellers are in control – definitely bearish.
Marubozu Candlesticks

Marubozu are even stronger bull or bear signals than long lines as they show that buyers/sellers have remained in control from the open to the close — there are no intra-day retracements.
Doji Candlesticks
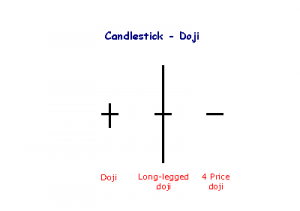
The doji candlestick occurs when the open and closing price are equal.
An open and close in the middle of the candlestick signal indecision. Long-legged dojis, when they occur after small candlesticks, indicate a surge in volatility and warn of a potential trend change. 4 Price dojis, where the high and low are equal, are normally only seen on thinly traded stocks.
Dragonfly
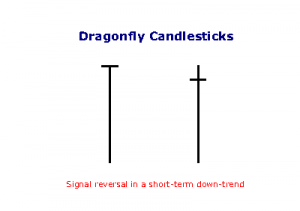
The dragonfly occurs when the open and close are near the top of the candlestick and signals reversal after a down-trend: control has shifted from sellers to buyers.
Hammer and Gravestone
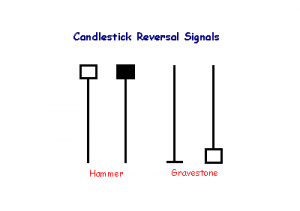
The hammer is not as strong as the dragonfly candlestick, but also signals reversal after a down-trend: control has shifted from sellers to buyers. The shadow of the candlestick should be at least twice the height of the body.
A gravestone is identified by open and close near the bottom of the trading range. The candlestick is the converse of a hammer and signals reversal when it occurs after an up-trend.
Hanging Man
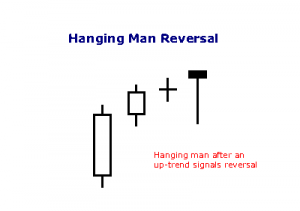
A hammer that occurs after an up trend is called a ‘hanging man’ and is a bearish signal.
Dark Cloud
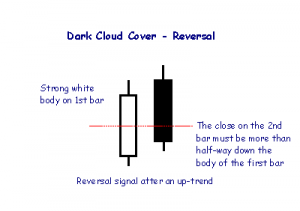
A Dark Cloud pattern encountered after an up-trend is a reversal signal, warning of “rainy days” ahead.
Piercing Line
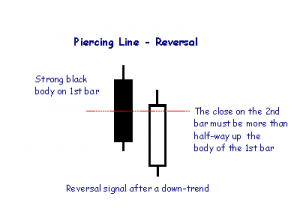
The Piercing Line is the opposite of the Dark Cloud pattern and is a reversal signal if it appears after a down-trend.
Engulfing Candlesticks
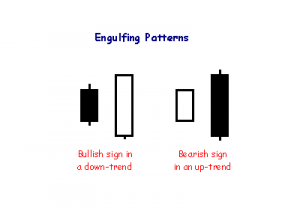
Engulfing patterns are where the body of the second candlestick ‘engulfs’ the first. They often follow or complete doji, hammer or gravestone patterns and signal reversal in the short-term trend.
Harami Candlestick
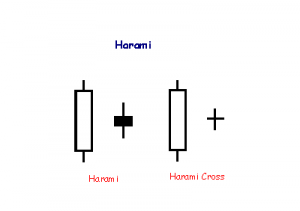
A Harami formation indicates loss of momentum and often warns of reversal after a strong trend. Harami means ‘pregnant’ which is quite descriptive. The second candlestick must be contained within the body of the first, though the shadows may protrude slightly.
Star Formations
Stars are similar to gaps. A long body followed by a much shorter candlestick with a short body, where the bodies must not overlap — though their shadows may.
Morning Star
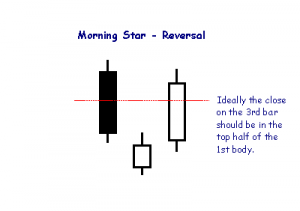
The Morning Star pattern signals a bullish reversal after a down-trend. The first candlestick has a long black body. The second candlestick gaps down from the first (the bodies display a gap, but the shadows may still overlap) and is more bullish if hollow. The next candlestick has a long white body which closes in the top half of the body of the first candlestick.
Evening Star
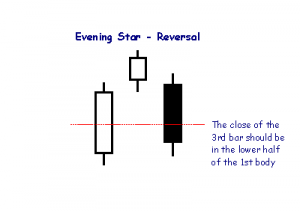
The Evening Star pattern is opposite to Morning Star and is a reversal signal at the end of an up-trend. The pattern is more bearish if the second candlestick is filled rather than hollow.
Doji Star
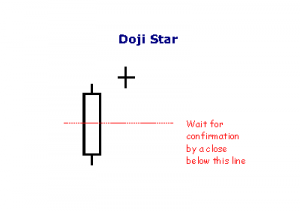
A Doji Star is weaker than the Morning or Evening Star: the doji represents indecision. The doji star requires confirmation from the next candlestick closing in the bottom half of the body of the first candlestick.
Shooting Star
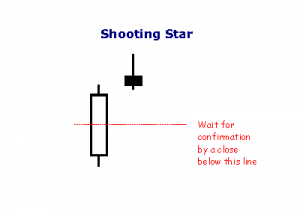
With a Shooting Star, the body on the second candlestick must be near the low — at the bottom end of the trading range — and the upper shadow must be taller. This is also a weaker reversal signal than the Morning or Evening Star.
The pattern requires confirmation from the next candlestick closing below half-way on the body of the first.
Rising Three Methods
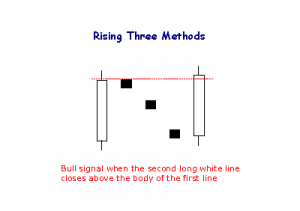
The Rising Method consists of two strong white lines bracketing 3 or 4 small declining black candlesticks. The final white line forms a new closing high. The pattern is definitely bullish.
Falling Three Methods
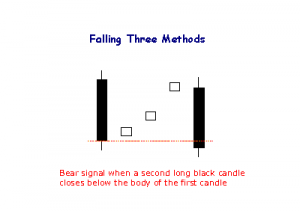
The bearish Falling Method consists of two long black lines bracketing 3 or 4 small ascending white candlesticks, the second black line forming a new closing low.
Evaluation
While candlesticks may offer useful pointers as to short-term direction, trading on the strength of candlestick signals alone is not advisable. Jack Schwager in Technical Analysis conducted fairly extensive tests with candlesticks over a number of markets with disappointing results.
Views – 1666


Commentary 091213
OSK - Technical Analyzer_FKLI FCPO_20131209_RHB Retail Research
MBB -
Most technical indicators are looking skewed towards further upside potential and in the absence of any bearish fundamentals prices seemed poised to retest the resistance at RM 2,692 in an “ascending flag” formation. A breakout may trigger a bout of short-covering taking the market to the next resistance target seen at RM 2,755. Immediate strong support is pegged at RM 2,656.
Market view: Sideways to higher. Any dip is expected to attract buying support.
FCPO Daily Commentary FCPO091213
Charts Hari ini
Trade
BUY 2665.00
SELL 2648.00
Rugi = 2665 – 2648 = 17 (RM 25 x 17 = RM425)
Kerugian sebenar = RM425 + RM30 = RM455
Kesilapan membuka pos BUY sewaktu market sedang jatuh. (sepatutnya tunggu sehingga market naik semula)
++ tidak boleh mengharap keanjaiban akan berlaku.
++ mesti ikut indikator / disiplin la sikit.
JANGAN LAKUKAN KESILAPAN INI LAGI !!!!!!!!!!
Views – 187