Monthly Archives: December 2013

You are browsing the site archives by month.

OSK - Technical Analyzer_FKLI FCPO_20131231_RHB Retail Research

MBB -

The continuing weak tone seen in soybean oil prices is expected to spill over into palm oil trading today. A technical market correction may be due before the year-end holiday. Nearest resistance is seen at RM 2,635 and support is pegged at RM 2,605. Buying interest is expected to keep prices maintained above psychological rounded price at RM 2,600 level unless sentiments change drastically.Market view: Sideways to lower bias. Stronger buying interest may support prices only on a sharp dip.

FCPO Daily CommentaryFCPO311213

Pada jam 11.15 pasaran berubah menjadi bullish sehingga tutup. Hari ini pergi hantar anak ke asrama, balik jam 6.30ptg. tiada trade.

Charts.

TF60M

311213

TF5M

311213-tf5m

Views – 154

OSK - Technical Analyzer_FKLI FCPO_20131230_RHB Retail Research

MBB -

No major bullish influence are in sight from overseas substitute soybean oil prices and with good soybean production expectations in Brazil and Argentina on ideal weather conditions, the market is expected to be slightly subdued due to the coming year end holiday.
Technically, we see a possibility of another sideways to minor downward correction on buying reservations to higher price. Immediate support is pegged at RM 2,620 and the next support at RM 2,605. Resistance level likely to cap prices is between RM 2,640 to RM 2,653.
Market view: Strong buying interest may surface on price dip. Going forward, the general view is that the market is consolidating for another potential upside wave breakout.

FCPO Daily Commentary - FCPO301213

Catatan:

  • Dalian SoyOil Mar14 – naik 44 point
  • Dalian Palm Oil Jan14 – naik 100 point
  • CBOT SoyOil Mar14 – naik 0.14%
Hari ini buka jam 10.30 gaps
  • BUY jam 10.32 pada 2640
  • SELL jam 11.05 pada 2643
Charts
TF60M
301213Trend dah mula berubah ke bearish
  • MACD < 0
  • CCI < 0
  • Close di bawah MA(13) & MA(21)

TF5M

301213_TF5M


Views – 168


Stochastic Oscillator

The Stochastic Oscillator was developed by Dr. George Lane to track market momentum.

The indicator consists of two lines:

  • %K compares the latest closing price to the recent trading range.
  • %D is a signal line calculated by smoothing %K.

The number of periods used in the indicator can be varied according to the purpose for which the Stochastic Oscillator is used:

Purpose: %K Periods %D Periods  Overbought level  Oversold level Comments
Combine with trend indicator 5 to 10 days 3 days 80% 20% Very sensitive
Stand-alone or trade longer cycles 14 or 21 days 3 days 70% 30% Only shows important turning points

Slow Stochastic incorporates further smoothing and is often used to provide a more reliable signal.

Stochastic Oscillator Trading Signals

If the Stochastic Oscillator hovers near 100 it signals accumulation. Stochastic lurking near zero indicates distribution.

The shape of a Stochastic bottom gives some indication of the ensuing rally. A narrow bottom that is not very deep indicates that bears are weak and that the following rally should be strong. A broad, deep bottom signals that bears are strong and that the rally should be weak.

The same applies to Stochastic tops. Narrow tops indicate that the bulls are weak and that the correction is likely to be severe. High, wide tops indicate that bulls are strong and the correction is likely to be weak.

Ranging Markets
Signals are listed in order of their importance:

  • Go long on bullish divergence (on %D) where the first trough is below the Oversold level.
  • Go long when %K or %D falls below the Oversold level and rises back above it.
  • Go long when %K crosses to above %D.

Short signals:

  • Go short on bearish divergence (on %D) where the first peak is above the Overbought level.
  • Go short when %K or %D rises above the Overbought level then falls back below it.
  • Go short when %K crosses to below %D.

Place stop-losses below the most recent minor Low when going long (or above the most recent minor High when going short).
%K and %D lines pointed in the same direction are used to confirm the direction of the short-term trend.
Lane also used Classic Divergences, a type of triple divergence.

Trending Markets

Only take signals in the direction of the trend and never go long when the Stochastic Oscillator is overbought, nor short when oversold.

Use trailing buy- and sell-stops to enter trades and protect yourself with stop-losses.

Long:

If %K or %D falls below the Oversold line, place a trailing buy-stop. When you are stopped in, place a stop loss below the Low of the recent down-trend (the lowest Low since the signal day).

Short:

If Stochastic Oscillator rises above the Overbought line, place a trailing sell-stop. When you are stopped in, place a stop loss above the High of the recent up-trend (the highest High since the signal day).

Exit:

Use a trend indicator to exit.

Stochastic Example

The Slow Stochastic Example illustrates the trading signals. This study focuses on the trailing stop entry technique used in a trending market.
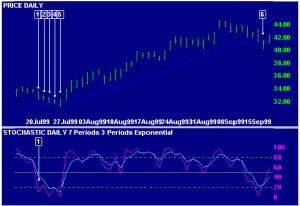
stocasticsI

ntel Corporation is shown with a 21 day exponential moving average (MA) and 7 day Stochastic %K and %D. The MA is used as the trend indicator with closing price as a filter.

  1. %K falls below 20. Place a trailing buy-stop just above the day’s High of $33 1/2.
  2. Move the buy-stop down to $33, above the High of day 2.
  3. Move the stop down to above the High of day 3.
  4. Move the stop down to $32 1/2 – one tick above the High on day 4.
  5. The day opens with a new Low of $31 3/8 and then rises until we are stopped in at $32 1/2. Place a stop-loss below the Low (i.e.. the lowest Low since day [1]). Thereafter, price falls back to the day’s Low, but fails to activate the stop-loss one tick below.
  6. Exit when price closes below the MA.

Stochastic Oscillator Setup

See Indicator Panel for directions on how to set up an indicator. The default settings are:

  • %K – 5 days
  • %D – 3 days
  • Both are calculated using simple moving averages
  • overbought level – 70%
  • oversold level – 30%

Stochastic Oscillator Formula

To calculate the Stochastic Oscillator:

  1. The first step is to decide on the number of periods (%K Periods) to be included in the calculation. The norm is 5 days, but this should be based on the time frame that you are analyzing.
  2. Then calculate %K, by comparing the latest Closing price to the range traded over the selected period:
    CL = Close [today] – Lowest Low [in %K Periods]
    HL =Highest High [in %K Periods] – Lowest Low [in %K Periods]
    %K = CL / HL *100
  3. Calculate %D by smoothing %K. The original formula used a 3 period simple moving average, but this can be varied, based on the time frame that you are analyzing.

Views – 276
Slow Stochastic

The Slow Stochastic applies further smoothing to the Stochastic oscillator, to reduce volatility and improve signal accuracy.

Trading Signals

Trading signals are the same as for the Stochastic oscillator.

Ranging Markets

Signals are listed in order of their importance:

  1. Go long on bullish divergence (on %D) where the first trough is below the Oversold level.
  2. Go long when %K or %D falls below the Oversold level and rises back above it.
  3. Go long when %K crosses to above %D.

Short signals:

  1. Go short on bearish divergence (on %D) where the first peak is above the Overbought level.
  2. Go short when %K or %D rises above the Overbought level then falls back below it.
  3. Go short when %K crosses to below %D.

Place stop-losses below the most recent minor Low (or above the most recent minor High) when going long (or short).

Trending Markets

Only take signals in the direction of the trend and never go long when Stochastic is overbought, nor short when oversold.

The shape of a Stochastic bottom gives some indication of the ensuing rally. A narrow bottom that is not very deep indicates that bears are weak and that the following rally should be strong. A broad, deep bottom signals that bears are strong and that the rally should be weak.

The same applies to Stochastic tops. Narrow tops indicate that the bulls are weak and that the correction is likely to be severe. High, wide tops indicate that bulls are strong and the correction is likely to be weak.

Use trailing buy- and sell-stops to enter trades and protect yourself with stop-losses.

Long:

If the Stochastic (%K or %D) falls below the Oversold line, place a trailing buy stop. When you are stopped in, place a stop loss below the Low of the recent down-trend (the lowest Low since the signal day).

Short:

If Stochastic rises above the Overbought line, place a trailing short stop. When you are stopped in, place a stop loss above the High of the recent up-trend (the highest High since the signal day).

Exit:

Use a trend indicator to exit.

Example

Johnson & Johnson is plotted with a 21 day exponential moving average (MA) and 5 day Slow Stochastic with %K and %D. Overbought/oversold levels are set at 70/30. Closing price is used as a filter on the MA.

slow_stocastics

  1. The market is trending upwards (price above the MA). %K twice crosses to above 80. Wait until the MA turns down before going short [S].
  2. %K crosses to below 20. Go long [L] when the MA turns upwards. Exit [X] when price closes below the MA.
  3. %K crosses to below 20. Go long [L] when the MA turns upwards.
  4. Price has been fluctuating around the MA which indicates that the market is ranging. Adjust the trading signals and overbought/oversold levels.
    Go short [S] when %K crosses to below % D. The trade is stopped out by a rally above the last minor High.
  5. A bearish divergence on %D signals to re-instate the short [S] position.
  6. %K crosses to above %D, signaling to go long [L].
  7. %K signals to go short [S] when it crosses below %D.
  8. A bullish divergence on %D signals to go long [L].
  9. %K rises above 70 and turns back below. Go short [S].
  10. There is a bullish, triple divergence on %D. Go long [L].
  11. %K crosses to below % D. Go short [S].
  12. Go long [L] when %K crosses to above %D. The market is still ranging, with price fluctuating around the MA.

Remember that the days shown are the signal days and that trades are only entered on the following day. Take a look at the exit [X] from [2]. Adjusting Stop Levels may provide faster exits.

Setup

See Indicator Panel for directions on how to set up an indicator. The default Slow Stochastic settings are:

  • %K – 5 days
  • %K slowing periods – 3 days
  • %D – 3 days
  • All are simple moving averages
  • overbought level – 70%
  • oversold level – 30%

Formula

To calculate the Stochastic Oscillator:

  1. The first step is to decide on the number of periods (%K Periods) to be included in the calculation. The norm is 5 days, but this should be based on the time frame that you are analyzing.
  2. Then calculate %K, by comparing the latest Closing price to the range traded over the selected period:
    CL = Close [today] – Lowest Low [in %K Periods]
    HL =Highest High [in %K Periods] – Lowest Low [in %K Periods]
    %K = CL / HL *100
  3. Calculate %D by smoothing %K. The original formula used a 3 period simple moving average, but this can be varied, based on the time frame that you are analyzing.

Slow Stochastic Oscillator
Many traders find the Stochastic Oscillator too volatile and prefer to use the Slow Stochastic:

  1. The %K [Slow] is equal to the %D [Fast] from the above formula.
  2. The %D [Slow] is calculated by smoothing %K [Slow]. This is normally done using a further 3 period simple moving average.

Views – 343

OSK – Technical Analyzer_FKLI FCPO_20131227_RHB Retail Research

MBB -

Today we see the softer soybean oil prices which may weigh on the CPO price especially after its 5-day rally. Selling at highs may be the strategy for today only as the CPO is still bullish in the short and medium term.

The nearest support is pegged at 2605 and further down at 2595. Resistance is pegged at 2645 and furher up at 2655.

FCPO Daily Commentary - FCPO271213

FBR

  • Malaysia ringgit fell for 10th week, its longest losing streak in almost 21 years, after US economic data bolstered the case for the Federal Reserve to further cut stimulus that had buoyed emerging markets.  2.50pm
  • Malaysia palm oil is expected to rebound inti a range of 2883 – 3058 RM per tonne over the next three months, as indicated by a Fibonacci retracement analysis anda an inverte head and shoulders. – the edge

Charts

Hari ini ada gaps pada jam 3.00 pm, naik sikit 10 point, lepas turun

TF60M

271213

TF5M

271213_TF5M

Views – 189