Fibonacci Numbers

Fibonacci numbers are named after Leonardo Fibonacci, a twelfth century Italian mathematician, who discovered the unique properties of a particular number sequence; apparently from studying the dimensions of the Great Pyramid at Gizeh in Egypt.

Fibonacci numbers

1, 1, 2, 3, 5, 8, 13, 21, 34, 55, 89, 144, 233, etc.

Each number in the sequence is the sum of the previous two numbers:
1 + 1 = 2,
1 + 2 = 3,
2 + 3 = 5,
and so on….


The Golden Ratio

As we progress along the sequence, the ratio of each number to its preceding number approaches closer and closer to the golden ratio: approximately 1.618. The golden ratio, often represented by the Greek letter Φ (Phi), is calculated as:

( 1 + √ 5 ) / 2

Each number is also approximately 0.618 of its successor. This reciprocal number, known as φ (phi), is calculated as:

( √ 5 – 1 ) / 2

Where √ 5 is the square root of 5.


  Fibonacci Golden Ratio and its Reciprocal
 Each number divided by its predecessor approaches 1.618  Each number divided by its successor approaches 0.618
  1/1   1.0   1/1 1.0
2/1  2.0  1/2 0.5
 3/2  1.5  2/3  0.666…
 5/3  1.666…  3/5  0.6
 8/5  1.6  5/8  0.625
 13/8  1.625  8/13  0.61538…
 21/13  1.61538…  13/21  0.61905…
 34/21  1.61905…  21/34  0.61765…
 55/34  1.61765…  34/55  0.61818…
 89/55  1.61818…  55/89  0.61798


Fibonacci Numbers in Nature

Fibonacci numbers occur throughout nature:

  • the arrangement of petals in most flowers
  • the arrangement of leaves on most plants
  • sea-shell spirals
  • the arrangement of seeds on sunflowers, pine cones and many other plant species.

While the Fibonacci number sequence may be prevalent in nature, it is not a universal law. There are many exceptions.

Fibonacci Ratios

Four ratios are normally plotted:

  • 0.618 (or 61.8 per cent), the reciprocal of the golden ratio, is the most important;
  • 0.50 (or 50 per cent) – the second number divided by the third (1 divided by 2);
  • 0.382 (or 38.2 per cent) – the reciprocal of the golden ratio squared (i.e. 89 / 233);
  • 0.236 (or 23.6 per cent) – the reciprocal of the golden ratio cubed (i.e. 55 / 233).

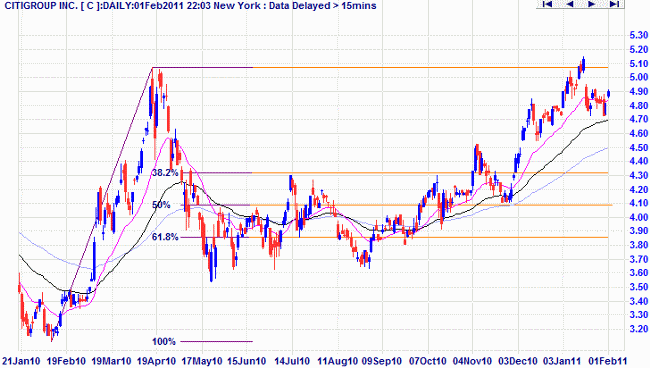
Fibonacci and Stocks

Fibonacci ratios regularly occur in stock market cycles and in the determination of support and resistance levels. Some traders attach almost mystical significance to them, but I have yet to find any statistical support for this.

The weakest of the Fibonacci ratios is 0.50. In fact some maintain that 0.50 is not really a Fibonacci ratio at all because it has no connection to the golden ratio. Nevertheless, it is probably the most prevalent: the first line of support in a rally is the previous peak — which often equates to a 50% retracement.

fibonacci_50pc_retracement

Views – 302

Fibonacci Retracements

Fibonacci Retracements are used to estimate likely reversal points during an up- or down-trend. Percentage retracement levels, based on significant Fibonacci numbers, are plotted as horizontal lines against the latest trend move.

Draw Fibonacci Retracements

  1. Select Fibonacci Retracements from the Draw menu or toolbar
  2. Drag your mouse over the selected range (of the rally or decline)

20110117_draw_fib-ret

  1. Select Highs and Lows for short-term charts or Closing Price for long-term
  2. Click the select button to complete the drawing.

20110117_draw_fib-ret_done

Note how the retracement found support at the 38.2% and 61.8% levels.

Set New Fibonacci Percentages

Add or delete Fibonacci levels by right-clicking on any Fibonacci Line and selecting Fibonacci Drawing Options (or select Draw >> Draw Options >> Fibonacci from the chart menu).

20110117_draw_fib-ret_options

You can add further levels, remove existing levels or reset the default fibonacci levels.

Set Fibonacci Colors

Amend Fibonacci colors by right-clicking on any Fibonacci Line and selecting Adjust Line Color.
To change the default color for all Fibonacci lines, select Format Charts >> Colors >> Fibonacci Retracements (or Extensions) from the chart menu.

20110117_draw_fib-ext_colours
Delete Fibonacci Lines

To delete Fibonacci Lines, right-click on one of the lines and select Delete from the menu.

Views – 271

ts-donc-02-msft-range

Weighted Moving Average

Weighted moving averages are difficult to construct but more reliable than the simple moving averages, where the average has a tendency to “bark twice”: once at the start of the moving average period and again at the end of the period.

Weighted Moving Average Formula

A Weighted moving average (WMA) attaches greater weight to the most recent data. The weighting is calculated from the sum of days.

Example:

For a 5-day weighted moving average the Sum of Days is 1+2+3+4+5 = 15
The weighting is shown below:

 Day 1  2  3  4  5
 Price ($)  16  17  17  10  17
 Weighting  1/15  2/15  3/15  4/15  5/15
 Weighted value  1.07  2.27 3.40  2.67  5.67
 5 Day WMA  15.07


Weighted values are calculated by multiplying today’s price by 5/15, yesterday by 4/15, and so on. The weighted moving average is the sum of the 5 weighted values.

Views – 293

Exponential Moving Average

Exponential moving averages are recommended as the most reliable of the basic moving average types. They provide an element of weighting, with each preceding day given progressively less weighting. Exponential smoothing avoids the problem encountered with simple moving averages, where the average has a tendency to “bark twice”: once at the start of the moving average period and again in the opposite direction, at the end of the period. Exponential moving average slope is also easier to determine: the slope is always down when price closes below the moving average and always up when price is above.

Formula

To calculate an exponential moving average (EMA):

  • Take today’s price multiplied by an EMA%.
  • Add this to yesterday’s EMA multiplied by (1 – EMA%).

If we recalculate the earlier table we see that the exponential moving average presents a far smoother trend:

 Day  1 2  3  4  5  6  7  8  9
 Price ($)  16 17  17  10  17  18  17  17  17
 33.3% (or 1/3) EMA  16.3  16.5  14.4  15.2  16.2  16.4  16.6  16.8

Exponential Moving Average Percentage

EMA% is the weighting attached to the current days value:

  • 50% would be used for a 3-day exponential moving average;
  • 10% is used for a 19-day exponential moving average; and
  • 1% is used for a 199-day exponential moving average.

To convert a selected time period to an EMA% use this formula:

        EMA% = 2/(n + 1) where n is the number of days

Example: The EMA% for 5 days is 2/(5 days +1) = 33.3%

Incredible Charts performs this calculation automatically when you select an EMA time period.


Views – 349

Simple Moving Average

The simple moving average is easy to construct, but not always the most accurate. They have a tendency to “bark twice” — as in the example below.

Simple Moving Average Formula

To calculate a 5 day simple moving average (“SMA”), take the sum of the last 5 days prices and divide by 5.

 Day  1  2  3  4  5  6  7  8  9
 Price ($)  16  17  17  10  17 18  17  17  17
 5 Day SMA  15.4  15.8  15.8 15.8  17.2


On day 9 there is a big step in the simple moving average, but price has been constant at $17. The low price on day 4 not only causes a drop in the simple moving average on day 4, but also distorts the moving average on day 9 — causing a jump in value when the low price is dropped from the moving average period. That is what is commonly referred to as “barking twice.

Views – 289