Stop Losses
A Stop-Loss is an order which is only placed in the market if price falls to a specified level (if short, the stop is activated if price rises to a specified level). If used correctly, they help to limit the losses on individual trades.
(a) Stop Losses
Stop-losses should be set as soon as each trade is confirmed. Set the stop-loss one tick below the lowest Low since the signal day.
(b) Maximum Acceptable Loss
Set your Maximum Acceptable Loss on any one trade, as a percentage of the capital committed. Never enter a trade if the stop-loss will exceed this limit.
A long-term investor/trader with reasonable risk diversification may set a limit of 6% while a short-term trader may set a limit of 2%.
(c) Setting Stop Levels
Be technically consistent when Setting Stop Levels. Use support and resistance, highs and lows or other technical levels for your limits.
(d) Adjusting Stop Levels
Using technical levels as in (c), Adjust Stops, over time, in the direction of the trend. This helps to protect your profits without fear of being stopped out before the trend is broken. A long-term investor/trader with reasonable risk diversification may find 6% an acceptable limit. A short-term trader may set a limit of only 2%.
Apart from adjusting stop levels upwards to below successive troughs, the alert trader should watch for chart patterns that may signal significant turning points. This doesn’t mean that stops should be adjusted for every minor reversal signal but it is advisable to adjust stops for very strong signals, such as head and shoulders, when confirmed by unusually high volume. When in doubt, take profits by adjusting the stop for only part of your position.
Example 1
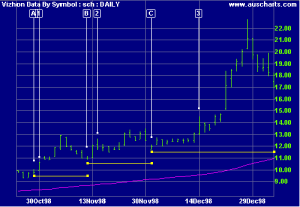
Charles Schwab with 150-day exponential moving average. The trendlines depict the stop levels as they are adjusted over time.
- The trade is entered on October 30th, day [1]. As soon as the trade is confirmed, set the stop-loss at just below the Low of the signal day [A].
- Price has formed a higher trough. Adjust the stop loss to just below the Low of [B].
- A higher trough is formed. Move the stop loss to below the Low of [C].
Adjust the stop upwards to below each successive low of the secondary cycle. Each new stop level is indicated by the start (left) of a new trendline. It is sometimes difficult to distinguish between the short cycle and the secondary cycle – weekly charts can be used to eliminate minor fluctuations.
Example 2
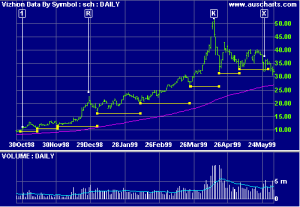
Charles Schwab with 150-day exponential moving average and 20-day volume moving average.
- Entry day.
- Unusually high volumes at the end of a strong up-trend lasting several months, alert us to the exhaustion gap in April ’99. The following day is a key reversal [K] with a very wide range.The combination is sufficiently extreme to justify moving the stops up to the High of the day prior to the gap. The position is stopped out when the gap is closed on the day following the key reversal [K].
- Patterns are easy to detect with hindsight – it is difficult at the time to distinguish between extreme signals such as [K] and more regular signals such as [R].
- If the [K] signal was used to take profits (say sell off 50% of the position) then the trader would continue to adjust stops upwards. Price breaks below the stop level at [X] and the remaining position is stopped out.
Views – 230

Recent Comments