Market Direction
The overall market influences the performance of smaller markets and individual stocks. Study the big picture first before looking at any shares in isolation.
(a) Time Frame
Decide on the cycle that you are going to trade:
- Long-term (or primary) trends that are measured in years;
- Intermediate (or secondary) trends of 3 weeks up to 6 months;
- Short-term cycles of less than 3 weeks; and
- Intra-day trends.
This will influence your indicator settings. More details can be found at Time Frames and Indicator Time Frames.
(b) Trend Indicator
Trade only in the direction of the overall market:
- Use a trend indicator to determine the direction in which the market is trending.
- Chart either the Dow Industrial Average, Standard & Poor 500 or the NASDAQ index.
- The Dow comprises the top 30 blue chip industrial stocks while the S&P 500 is more representative of the entire market. The NASDAQ has more influence on tech stock prices.
- In addition, chart a local market index such as the FTSE 100 for the UK market or the ASX 200 for Australia, if you are trading outside the USA.
Reading The Market discusses a number of systems used to determine market direction.
Example
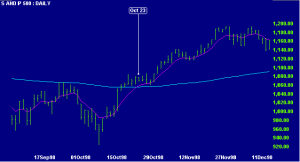
The Standard & Poor 500 is charted with 7-day and 150-day exponential moving averages, used to track the primary trend.
- An up-trend is signaled on October 23rd when:
- The fast MA crosses to above the slow MA; and
- The slow MA slopes upwards.
Views – 221

Recent Comments