Monthly Archives: December 2013

You are browsing the site archives by month.

Moving Average Indicator

Moving averages provide an objective measure of trend direction by smoothing price data. Normally calculated using closing prices, the moving average can also be used with median, typical , weighted closing, and high, low or open prices as well as other indicators.
Moving Average Time Frames

Shorter length moving averages are more sensitive and identify new trends earlier, but also give more false alarms. Longer moving averages are more reliable but less responsive, only picking up the big trends.

Use a moving average that is half the length of the cycle that you are tracking. If the peak-to-peak cycle length is roughly 30 days, then a 15 day moving average is appropriate. If 20 days, then a 10 day moving average is appropriate. Some traders, however, will use 14 and 9 day moving averages for the above cycles in the hope of generating signals slightly ahead of the market. Others favor the Fibonacci numbers of 5, 8, 13 and 21.

  • 100 to 200 Day (20 to 40 Week) moving averages are popular for longer cycles;
  • 20 to 65 Day ( 4 to 13 Week) moving averages are useful for intermediate cycles; and
  • 5 to 20 Days for short cycles.

Trading Signals

The simplest moving average system generates signals when price crosses the moving average:

  • Go long when price crosses to above the moving average from below.
  • Go short when price crosses to below the moving average from above.

The system is prone to whipsaws in ranging markets, with price crossing back and forth across the moving average, generating a large number of false signals. For that reason, moving average systems normally employ filters to reduce whipsaws.

More sophisticated systems use more than one moving average.

  • Two Moving Averages uses a faster moving average as a substitute for closing price.
  • Three Moving Averages employs a the third moving average to identify when price is ranging.
  • Multiple Moving Averages use a series of six fast moving averages and six slow moving averages to confirm each other.
  • Keltner Channels use bands plotted at a multiple of average true range to filter moving average crossovers.
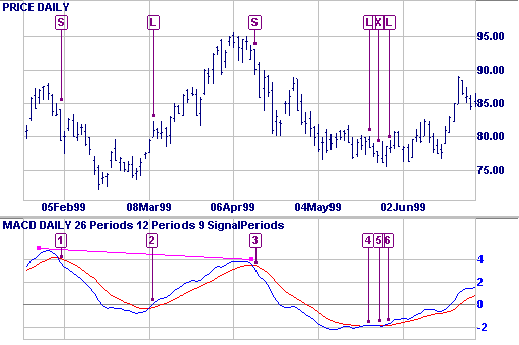
  • The popular MACD (“Moving Average Convergence Divergence”) indicator is a variation of the two moving average system, plotted as an oscillator which subtracts the slow moving average from the fast moving average.

Moving Average Types

There are several different types of moving averages, each with their own peculiarities.

  • Simple moving averages are the easiest to construct, but also the most prone to distortion.
  • Weighted moving averages are difficult to construct, but reliable.
  • Exponential moving averages achieve the benefits of weighting combined with ease of construction.
  • Wilder moving averages are used mainly in indicators developed by J. Welles Wilder. Essentially the same formula as exponential moving averages, they use different weightings — for which users need to make allowance.

Setup

Indicator Panel shows how to set up moving averages.

The default setting is a 21 day exponential moving average.

Views – 430

MACD Indicator

The MACD indicator is basically a refinement of the two moving averages system and measures the distance between the two moving average lines. MACD is an acronym for Moving Average Convergence Divergence.

MACD was developed by Gerald Appel and is discussed in his book, The Moving Average Convergence Divergence Trading Method.

MACD Trading Signals

The MACD indicator is primarily used to trade trends and should not be used in a ranging market. Signals are taken when MACD crosses its signal line, calculated as a 9 day exponential moving average of MACD.
Trending Market

First check whether price is trending. If the MACD indicator is flat or stays close to the zero line, the market is ranging and signals are unreliable.

  • Go long when MACD crosses its signal line from below.
  • Go short when MACD crosses its signal line from above.

Signals are far stronger if there is either:

  • a divergence on the MACD indicator; or
  • a large swing above or below the zero line.

Unless there is a divergence, do not go long if the signal is above the zero line, nor go short if the signal is below zero. Place stop-losses below the last minor Low when long, or the last minor High when short.

Example 1

Microsoft Corporation chart with: MACD, and MACD signal line.

msft macd signals

  1. Go short [S] – MACD crosses to below the signal line after a large swing.
  2. Go long [L] when MACD crosses to above the signal line.
  3. Strong short signal [S] – the MACD crosses after a large swing and bearish divergence (shown by the trendline).
  4. Go long [L]. Flat MACD signals that the market is ranging – we are more likely to be whipsawed in/out of our position.
  5. Exit long trade [X] but do not go short – MACD is significantly below the zero line.
  6. Re-enter your long trade [L].

MACD Setup

The default settings for the MACD indicator are:

  • Slow moving average – 26 days
  • Fast moving average – 12 days
  • Signal line – 9 day moving average of the difference between fast and slow.
  • All moving averages are exponential.

See Indicator Panel for directions on how to set up an indicator. See Edit Indicator Settings to change the settings.

Captions and trendlines: Use MACD Histogram if you want to draw trendlines or place captions on the histogram. Otherwise, they are left “hanging in the air” if you zoom or change time periods.

MACD Formula

The MACD indicator is calculated as the difference between the fast and slow moving averages:

MACD = 12 Day exponential moving average – 26 Day exponential moving average

The signal line is calculated as a 9 day exponential moving average of MACD.

Example 2

Johnson & Johnson with a 12 day , and a 26 day exponential moving average (EMA) plotted on the price chart. MACD reflects the difference between the fast and slow EMA. The signal line is a 9 day EMA of the MACD indicator.

jnj macd
Observe that:

  • MACD is furthest from the zero line when the gap between the two EMAs is widest.
  • MACD is at zero when the two EMAs cross (the trading signal when using two moving averages).
  • MACD fluctuates between 1.0 and -1.0 when the market is ranging.

Views – 469

RSI Indicator – Relative Strength Index

Relative Strength Index (RSI) is a popular momentum oscillator developed by J. Welles Wilder Jr. and detailed in his book New Concepts in Technical Trading Systems.

The Relative Strength Index compares upward movements in closing price to downward movements over a selected period. Wilder originally used a 14 day period, but 7 and 9 days are commonly used to trade the short cycle and 21 or 25 days for the intermediate cycle. Please note that Wilder does not use the standard moving average formula and the time period may need adjustment.

RSI is smoother than the Momentum or Rate of Change oscillators and is not as susceptible to distortion from unusually high or low prices at the start of the window (detailed in Momentum). It is also formulated to fluctuate between 0 and 100, enabling fixed Overbought and Oversold levels.

RSI Trading Signals

Different signals are used in trending and ranging markets. The most important signals are taken from overbought and oversold levels, divergences and failure swings.

Use trailing buy- and sell-stops to time entry into trades.

Ranging Markets

Set the Overbought level at 70 and Oversold at 30.

  • Go long when RSI falls below the 30 level and rises back above it or on a bullish divergence where the first trough is below 30.
  • Go short when RSI rises above the 70 level and falls back below it or on a bearish divergence where the first peak is above 70.

Failure swings strengthen other signals.

Trending Markets

Only take signals in the direction of the trend.

  • Go long, in an up-trend, when RSI falls below 40 and rises back above it.
  • Go short, in a down-trend, when RSI rises above 60 and falls back below it.

Exit using a trend indicator.

Take profits on divergences. Unless confirmed by a trend indicator, Relative Strength Index divergences are not strong enough signals to trade in a trending market.
Example

Wal-Mart Stores Inc. is plotted with a 21 day exponential moving average (MA) and 9 day Relative Strength Index (RSI). A 2-day closing filter is used with the MA.

wmt rsi

  1. Price is trending downwards (staying below the moving average). Do not take long signals until the MA turns upward, otherwise we are trading against the trend.
  2. A bullish divergence on Relative Strength Index is reinforced by completion of a failure swing at [2]. Go long [L] when the MA slopes upwards and RSI crosses to above 40.
  3. RSI completes a minor failure swing at [3]. Take profits [P] and exit the remaining position [X] when there are two closes below the MA. Do not go short as price is trending upwards (staying above the moving average).
  4. Price has started to fluctuate around the moving average, signaling a ranging market. Go short [S] when RSI crosses from above to below 70.
  5. Go long [L] when RSI crosses from below to above 30.
  6. There has been a breakout from the trading range and price is trending upwards. Do not close the long position.
  7. Take profits [P] on the bearish divergence (Price has completed a higher peak while RSI has experienced a lower peak).
  8. Take profits [P]. A bearish triple divergence is confirmed by completion of a large failure swing at [8].
  9. Increase your long position [L]. RSI has crossed from below to above 40 during an up-trend. Exit your position [X] when there are two closes below the MA. Do not go short as the still slopes upwards.
  10. A small bearish divergence warns of a possible trend reversal.
  11. A bearish triple divergence is reinforced by completion of a failure swing at [11]. Wait until the MA has turned down and RSI has crossed to below 60 before entering a short trade [S].

RSI Setup

See Indicator Panel for directions on how to set up Relative Strength Index.

The default RSI window is set at 14 days with Overbought/Oversold levels at 70% and 30%. To alter the default settings – see Edit Indicator Settings.

RSI Formula

The steps in calculation of the Relative Strength Index are:

  1. Decide on the RSI Period, based on the time frame that you wish to analyze.
  2. Compare Closing price [today] to Closing price [yesterday].
  3. For the RSI Period, add all upward movements in Closing price.
  4. For the RSI Period, add all downward movements in Closing price.
  5. Calculate the exponential moving average* of price movements:
  6. Average Upward Price Move = Exponential Moving Average of Upward Movements
    Average Downward Price Move = Exponential Moving Average of Downward Movements
  7. Calculate Relative Strength (RS):
  8. RS = Average Upward Price Move / Average Downward Price Move
  9. Calculate the Relative Strength Index (RSI):

RSI = 100 – 100 / ( 1 + RS )

*Welles Wilder’s Indicators

Users should beware, when setting time periods for Welles Wilder’s indicators, that he does not use the standard exponential moving average formula. See

We recommend that users try shorter time periods when using one of the above indicators. For example, if you are tracking a 30-day cycle you would normally select a 15-day Indicator Time Period. With the RSI, adjust the time period as follows:

             RSI time period = (n + 1) / 2 = (15 + 1) / 2 = 8 days

Views – 569

MACD Histogram

The signals from the MACD indicator tend to lag price movements. The MACD Histogram attempts to address this problem by plotting the distance between MACD and its signal line. Because of this, the histogram signals trend changes well in advance of the normal MACD signal, but is less reliable and should be confirmed by other indicators.

Only trade with Histogram signals when the market is trending.

The MACD Histogram can also be used to track longer cycles, using weekly or monthly data.

Trading Signals

Use Stop Losses with all trades.


Ranging Markets

Signals are stronger if

  • There is a bullish divergence on the Histogram; or
  • The signal occurs far from the zero line.

Disregard signals close to the zero line unless confirmed by a divergence.

  • Go long when the MACD Histogram turns up below zero.

Close the position when there is a signal to go short.

  • Go short when MACD Histogram turns down above zero.

Close the position when there is a signal to go long.


Trending Markets

Only trade in the direction of the trend. Signals close to the zero line are accepted provided the trend is intact.

  • Go long when the MACD Histogram turns up below zero.
  • Go short when MACD Histogram turns down above zero.

Use a trend indicator, such as a moving average, to exit from trends.

Example

Intel Corporation is shown with MACD histogram and 21-day exponential moving average. Trendlines show divergences.

intc macd histogram 99

Mouse over chart captions to display trading signals.

  1. Price is ranging – indicated by the flat MA. Go long [L] when the histogram turns up (far from the zero line). Place a stop below the recent Low.
  2. Go short [S] as the histogram turns down (far from the zero line). Place a stop above the recent High.
  3. Go long [L] – the histogram turns up and is reinforced by a bullish divergence. Place a stop below the recent Low.
  4. Go short [S] as the histogram turns down – reinforced by a bearish divergence. Place a stop above the recent High.
  5. Ignore the signal as it is too close to the zero line.
  6. Go long [L] as the histogram turns up when well below zero. Place a stop below the recent Low.
  7. A further signal to go short [S]. Place a stop above the recent High.
  8. Go long [L] – the histogram has turned up and is reinforced by a bullish divergence. Price has broken clear of the trading range and the MA is rising – exit [X] when price closes below the MA.

Setup
The default settings are:

  • Slow moving average – 26 days
  • Fast moving average – 12 days
  • Signal line – 9 day moving average of the difference between fast and slow.
  • All moving averages are exponential.

To alter the default settings – see Edit Indicator Settings. See Indicator Panel for directions on how to set up an indicator.

Captions and trendlines: Do not use MACD if you want to draw trendlines or place captions on the histogram. These are left “hanging in the air” if you zoom or change time periods.

Views – 352

MBB

CPO February futures closed RM 15 a ton lower at RM 2,641 in a sideways trading pattern, taking a breather from previous day’s rally on slightly lesser across the board volume of 27,711 lots changing hands.
Some fundamental concerns about higher stocks outlook capped the advance while worries of lower production due to extreme weather cushioned the decline. Technically though, February contract price is well-supported above the 20 period simple moving averages with no bearish signal. As such, there are possibilities for the market to re-test the recent highs now or later.A breakout above the nearest resistance pegged at RM 2,662 is deemed as having further upside potential while a decline below RM 2,619 at the close will depict bearish tendencies.
Market view: Price is expected to move indecisively sideways within a tight choppy day-trading range as market forces appears to be evenly matched.FCPO Daily Commentary  FCPO06122013


OSK

Technical Analyzer_FKLI FCPO_20131206_RHB Retail Research

Comment Me:

TREND UP

TF30M

TA061213C

Open BUY pada 2650.00 3.30 ptg

TF1D

TF1D_0061213


Views – 209