Category Archives: Trading Strategy

Trading the Short-term Trend

Never trade against the trend – a fundamental principle in technical analysis. That’s easy enough to follow, but how do you determine the trend? There are as many techniques as there are days in the year, ranging from the original Dow Theory, through to highly complex Fourier wave analysis.

A reliable approach to measuring the intermediate trends is to combine the signals of the MACD and Slow Stochastic indicators. Introduced by Joe Duffy in Futures magazine, the technique has the advantage of simplicity and eliminates trader discretion – a fatal flaw in many trading systems.

Duffy sets the MACD at 30-10-10 (compared to the standard 26-12-9 days) and combines this with a 20-day Slow Stochastic. The combination of the two indicators increases reliability.
Trading Signals

Long positions:
Look for buy signals when both the MACD and Slow Stochastic are above their signal lines.
Do not take signals if one of the indicators has crossed to below its’ signal line.
Exit when both indicators cross to below their signal lines.

For short positions, reverse the process:
Look for sell signals when both the MACD and Slow Stochastic are below their signal lines.
Do not take signals if one of the indicators is above its’ signal line.
Exit when both indicators cross to above their signal lines.

Example

The Australian All Ordinaries is charted with a 21-day exponential moving average, 30-10-10-day MACD and 20-3-3-day Slow Stochastic, with signal lines.

The MACD and Slow Stochastic are both above their signal lines. Take new long positions.
MACD and Slow Stochastic have both crossed to below their signal lines. Exit all long positions.

Buy and sell signals should be entered using a short-term Momentum Indicator and Trailing stops.

Views – 155

Exit Signals

Trade Indicators

Use a Trend Indicator to exit from the trend. Adjust the Indicator Time Frame to suit the cycle being traded.

Example

Charles Schwab with weekly price bars and 7-day and 150-day exponential moving averages.
sch weekly ma150

  • Entry [L] on 30 October 1998 at $10.13.
  • Exit on Key Reversal at [K] on 15 April 1999 at $44.75.
  • Remaining position stopped out at [X] on 25 May 1999 at $33.13.
  • Price crosses below MA150 at [Y] on 14 June 1999 at $27.25.
  • MA7 crosses below MA150 at [Z] on 4 August 1999 at $24.50.

If no stops had been activated, the position would have been closed either:

  • At [Y] when price fell below the 150-day moving average; or
  • At [Z] when the 7-day MA fell below the 150-day MA,

depending on the exit strategy.

Trade Summary

Entry [L] October 30, 1998 $10.13
Key Reversal [K] April 15, 1999 $44.75
Stopped Out [X] May 25, 1999 $33.13
Price crosses below MA150 [Y] June 14, 1999 $27.25
MA7 crosses below MA150 [Z] August 4, 1999 $24.50

Returns vary between 440 per cent and 240 per cent.

Note how important it is to exit at the right time in addition to timing the entry : the correction retreated to below $18.00.

Views – 193


Stop Losses

A Stop-Loss is an order which is only placed in the market if price falls to a specified level (if short, the stop is activated if price rises to a specified level). If used correctly, they help to limit the losses on individual trades.

(a) Stop Losses

Stop-losses should be set as soon as each trade is confirmed. Set the stop-loss one tick below the lowest Low since the signal day.

(b) Maximum Acceptable Loss

Set your Maximum Acceptable Loss on any one trade, as a percentage of the capital committed. Never enter a trade if the stop-loss will exceed this limit.

A long-term investor/trader with reasonable risk diversification may set a limit of 6% while a short-term trader may set a limit of 2%.

(c) Setting Stop Levels

Be technically consistent when Setting Stop Levels. Use support and resistance, highs and lows or other technical levels for your limits.

(d) Adjusting Stop Levels

Using technical levels as in (c), Adjust Stops, over time, in the direction of the trend. This helps to protect your profits without fear of being stopped out before the trend is broken. A long-term investor/trader with reasonable risk diversification may find 6% an acceptable limit. A short-term trader may set a limit of only 2%.

Apart from adjusting stop levels upwards to below successive troughs, the alert trader should watch for chart patterns that may signal significant turning points. This doesn’t mean that stops should be adjusted for every minor reversal signal but it is advisable to adjust stops for very strong signals, such as head and shoulders, when confirmed by unusually high volume. When in doubt, take profits by adjusting the stop for only part of your position.

Example 1

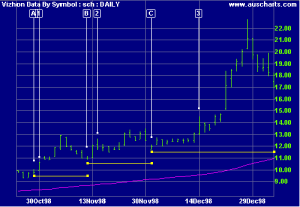
Charles Schwab with 150-day exponential moving average. The trendlines depict the stop levels as they are adjusted over time.sch stops


  1. The trade is entered on October 30th, day [1]. As soon as the trade is confirmed, set the stop-loss at just below the Low of the signal day [A].
  2. Price has formed a higher trough. Adjust the stop loss to just below the Low of [B].
  3. A higher trough is formed. Move the stop loss to below the Low of [C].

Adjust the stop upwards to below each successive low of the secondary cycle. Each new stop level is indicated by the start (left) of a new trendline. It is sometimes difficult to distinguish between the short cycle and the secondary cycle – weekly charts can be used to eliminate minor fluctuations.


Example 2

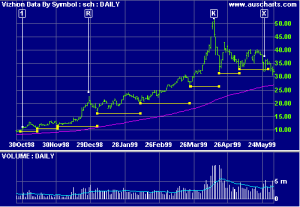
Charles Schwab with 150-day exponential moving average and 20-day volume moving average.

sch key reversal and volume

    • Entry day.
    • Unusually high volumes at the end of a strong up-trend lasting several months, alert us to the exhaustion gap in April ’99. The following day is a key reversal [K] with a very wide range.The combination is sufficiently extreme to justify moving the stops up to the High of the day prior to the gap. The position is stopped out when the gap is closed on the day following the key reversal [K].
    • Patterns are easy to detect with hindsight – it is difficult at the time to distinguish between extreme signals such as [K] and more regular signals such as [R].
    • If the [K] signal was used to take profits (say sell off 50% of the position) then the trader would continue to adjust stops upwards. Price breaks below the stop level at [X] and the remaining position is stopped out.

Views – 201

Entry & Exit Signals 

(a) Entry Signals

The merits of the different oscillators are discussed at Momentum Indicators. It is also possible to use an oscillator such as the Money Flow Index or MACD to time your entry points. In fact, some analysts do not use indicators at all and base their entry points on breakouts above resistance levels.

Set the Indicator Time Frame to suit the cycle being traded. There is a trade-off between indicator responsiveness and reliability: a very short time frame may provide earlier, but occasionally incorrect, signals. Trailing stops help to compensate for this.

(b) Trailing Stops

Trailing Stops are useful for weeding out premature or false signals and help to alleviate some of the psychological pressure on traders – by providing automatic entry and exit points.

Example

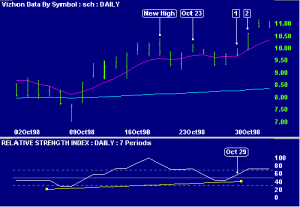
Charles Schwab with 7-day and 150-day exponential moving averages and 7-day relative strength index.

sch ma150 rsi7

  1. Favorable trading conditions (from Steps 2 & 3) commence on October 23rd. Shortly thereafter the RSI crosses to below zero and turns back above the zero line, giving a signal to go long [Oct 29]. The signal is strengthened by a failure swing, shown by the trendline. Place a buy stop order above the High on the signal day [1].
  2. We are stopped in on day [2] when price rises above the High of the previous day. By the close the stock had formed a new High, surpassing the High of October 20th.

Views – 125

Trend Direction

Trade only in the direction of the trend:

Use a trend indicator to identify whether the security is trending or ranging. Only take signals if the security is trending upwards.

Example

Charles Schwab is charted with 7-day and 150-day exponential moving averages, used to track the primary trend.

sch ma150

By October 23rd, when the market signals an up-trend [M], the stock is trending strongly upwards:

  • The fast MA crosses above the slow MA at [T]; and
  • The slow MA slopes upwards.

This is also evident from the successively higher peaks and troughs on the secondary cycle and the new High reached on October 20th.

Views – 192